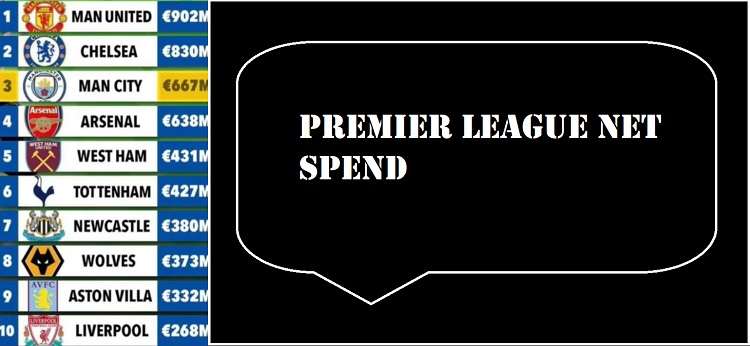
Premier League has out spent entire Europe in Summer 2021 which goes to show the buying power of Premier League clubs even under harsh covid-19 pandemic crises. After the 2021 summer and 2022 winter transfer window concluded Premier League Net Spend of £756 million (summer & January windows combined) which dwarfs all other top 5 European leagues combined total.
2021 summer transfer window showed Premier League is recovering from the covid-19 financial crises. Premier League clubs spend a combine total of £ 1.04 billion on players transfers in summer 2021 window followed by another £322.9m in January 2022 window. Below is the club by club breakdown of transfer spending and earnings both in summer and January transfer windows.
Summer 2021 Transfer Net Spend:
In the summer of 2021, premier clubs spent £1.04 billion on transfers but managed to recoup £446m taking combine net spend of premier league to £593 million.
January 2022 Transfer Net Spend:
£322.9m was spend on new transfers by premier league clubs. £159.7m was recouped in selling players taking total net spend for January window to £163.2m during the January 2022 transfer window which is the highest since 2018 showing Premier league is recovering from covid-19 financial issues.
Premier League’s combined net spend (summer & winter windows) stands at £756 million. That is £1.36 billion in transfer spending and £605 million transfer income giving a – £751m combined net spend by premier league in summer and january transfer window.
Arsenal’s -£122.42 million net spend make them the highest spenders in summer and winter windows combined. While only 5 teams in premier league can show a positive net spend.
| CLUB | TRANSFER SPEND | TRANSFER INCOME | NET SPEND | |
|---|---|---|---|---|
| 1 | Southampton | £38.79m | £54.33m | +£15.54m |
| 2 | Everton | £35.55m | £41.40m | +£5.85m |
| 3 | Brighton | £66.33m | £70.65 | +£4.32m |
| 4 | Chelsea | £106.20m | £109.76m | +£3.56m |
| 5 | Aston Villa | £116.84m | £114.30m | +£2.54m |
| 6 | Wolverhampton | £31.40 | £26.31 | -£5.09 |
| 7 | Burnley | £41.31m | £35.37m | -£5.94m |
| 8 | Norwich City | £57.65m | £34.56m | -£23.09m |
| 9 | Watford | £39.15m | £11.57m | -£27.59m |
| 10 | Brentford | £33.03m | £900,000 | -£32.13m |
| 11 | Manchester City | £130.05m | £84.42m | -£45.63m |
| 12 | Liverpool | £76.50m | £24.75m | -£51.75m |
| 13 | Leeds United | £53.01m | £0m | -£53.01m |
| 14 | Tottenham Hotspurs | £86.31 | £30.71 | -£55.60 |
| 15 | Leicester City | £60.84m | £3.60m | -£57.24m |
| 16 | West Ham | £62.22 | £3.54 | -£58.69 |
| 17 | Crystal Palace | £75.99m | £0m | -£75.99m |
| 18 | Manchester United | £126.00m | £27.63m | -£98.37m |
| 19 | Newcastle United | £118.35m | £0m | -£118.35m |
| 20 | Arsenal | £150.68m | £28.26m | -£122.42m |

The above transfer financial date represents only the official transfer fees quoted by the selling and buying club. We did not include any addons or some vague transfer details given in popular tabloids. Agents fee (If any) is not included in the numbers above. Check out our article on how much every premier league club spent on agents fee


